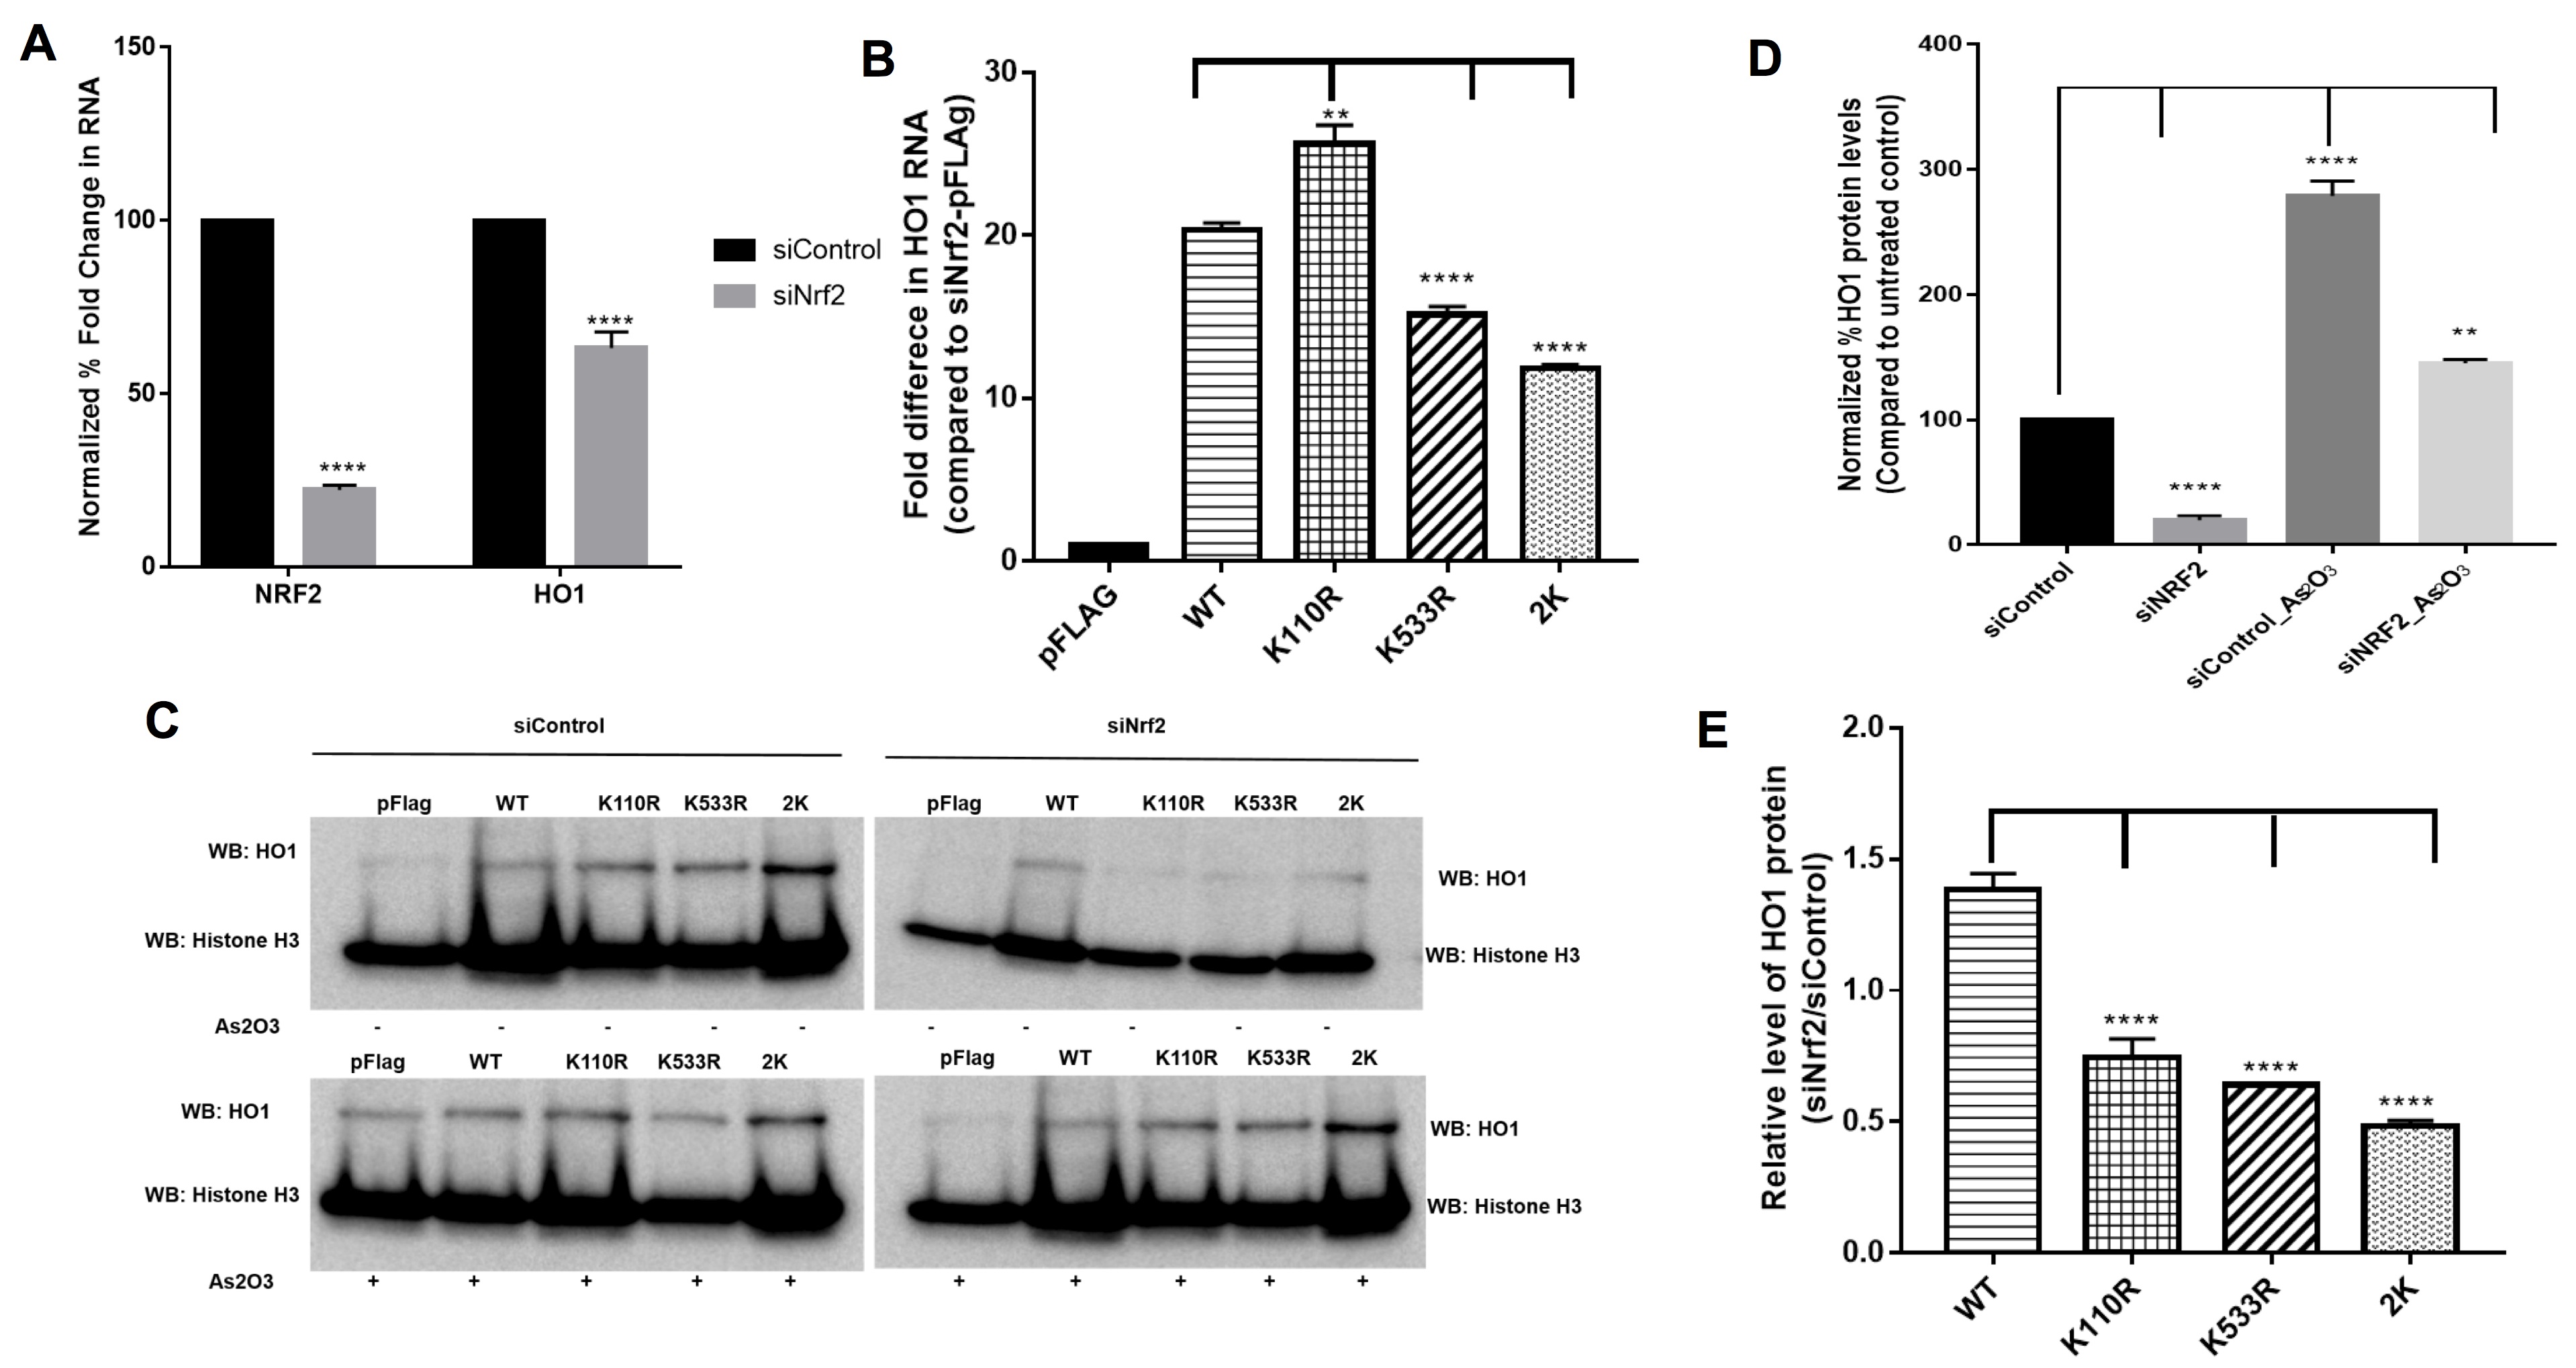
Fig. 3. Nrf2-dependent gene transcription of Heme Oxygenase 1 (HO-1) gene is reduced in the absence of K110 and K533 of Nrf2 protein. To study the significance of the SUMO-acceptor lysine in Nrf2 rescue experiments were performed using plasmid expressing either wild type Flag-hNrf2 (WT) or different mutant Flag-hNrf2 (K110R, K533R or 2K (K110R/K533R) double mutant) in the HEK293T cells treated with siRNA against Nrf2. pCMV-Flag vector (pFlag) alone was used as a control. A, shown is real-time RT-PCR analysis of the levels of Nrf2 and HO-1 mRNAs in HEK293T cells treated with control siRNA or Nrf2 siRNA. 18s rRNA mRNA was used as a normalization control. Results are the mean ± S.E. (n = 3). **** indicates statistical significance, p<0.001. B, shown is real-time RT-PCR analysis of the levels of HO1 mRNAs in HEK293T cells post rescue with WT or mutant Nrf2 after siRNA mediated knock down of endogenous Nrf2 for 48 hrs,. 18s rRNA mRNA was used as a normalization control. Results are the mean ± S.E. (n = 3). **** indicates statistical significance, p<0.001 for all observations compared to that for vector-only control. C, Western blot analysis shows the effect of the wild type and mutant Nrf2 on the HO-1 protein level in HEK293T treated with either control siRNA or Nrf2 siRNA without activation from As2O3 (-) and with activation from As2O3 (+). Histone-H3 is used as a loading control. D, shown is the densitometric analysis of the pFlag lanes from panel C to show the relative levels HO-1-protein in HEK293T cells treated with either control siRNA (siControl) or siRNA against Nrf2 (siNrf2) without activation, or with siRNA and activation by treatment with As2O3 (siControl_As2O3 and siNrf2_As2O3). Histone-H3 is used as a normalization control. Results are mean ±S.E. (n=4). **** indicates there is a statistically significant difference in all observations compared to siControl. E, shown is densitometric analysis of the Western blot in panel C to evaluate the relative levels of HO-1 protein after rescue experiment. Results are shown as fold change over the empty vector transfected cells post activation by As2O3. Results are the mean ± S.E. (n = 4). **** indicates statistical significance p<0.001.